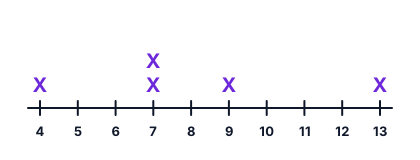
In Grade 5, students interpret whole-number data in tables or line plots by finding the mean, median, mode, and range.
Mean = add all values and divide by how many there are. Median = the middle value when ordered. Mode = the value that appears most. Range = greatest − least.
Official benchmarkInterpret numerical data, with whole-number values, represented with tables or line plots by determining the mean, mode, median or range.
On the FAST test: part of the Grade 5 reporting category Geometric Reasoning, Measurement, and Data Analysis and Probability, which is about 23–29% of the test.
Worked Examples
Worked Example 1
All Four Measures
Data: 4, 7, 7, 9, 13
1Mean: 4 + 7 + 7 + 9 + 13 = 40; 40 ÷ 5 = 8.
2Median: the middle value is 7.
3Mode: 7 appears twice.
4Range: 13 − 4 = 9.
Answer: Mean 8, median 7, mode 7, range 9
Worked Example 2
Median with an Even Count
Data: 6, 8, 10, 12
1There are two middle values: 8 and 10.
2Find the number halfway between them: (8 + 10) ÷ 2 = 9.
Answer: Median 9
Common Mistakes to Watch For
Finding the median without ordering
Wrong:Data 12, 15, 9, 15, 19 → median 9
Order first: 9, 12, 15, 15, 19. The median is 15.
Confusing range with the greatest value
Wrong:Range of 9, 12, 15, 15, 19 = 19
Range is greatest minus least: 19 − 9 = 10.
Helpful Math Tip
Always order the data from least to greatest first. It makes the median, mode, and range easy to find.
Independent Educational Platform. FastChomp is published by Tropical Learning LLC and is not affiliated with, sponsored by, or endorsed by the Florida Department of Education. FAST and Star assessment names are referenced for informational purposes only. FastChomp practice questions are original educational materials, not official Florida FAST assessment questions.