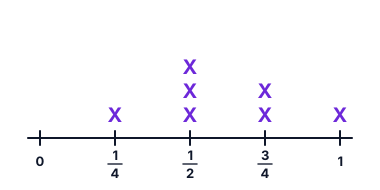
In Grade 5, students collect and display numerical data, including fractions and decimals, using tables, line graphs, and line plots.
Line plots are great for showing how often each measurement appears; line graphs show how something changes over time.
Official benchmarkCollect and represent numerical data, including fractional and decimal values, using tables, line graphs or line plots.
On the FAST test: part of the Grade 5 reporting category Geometric Reasoning, Measurement, and Data Analysis and Probability, which is about 23–29% of the test.
Worked Examples
Worked Example 1
Making a Line Plot
Pencil lengths (in.): 14, 12, 12, 34, 12, 1, 34
1Draw a number line from 0 to 1 marked in fourths.
2Put one X above each length.
312 has 3 Xs, 34 has 2, and 14 and 1 have 1 each.
Answer: 12 inch is the most common length
Worked Example 2
Choosing a Graph
A plant's height measured every week
1The data shows change over time.
2A line graph connects the points to show that change.
Answer: Line graph
Common Mistakes to Watch For
Uneven spacing on the number line
Wrong:Marks at 14, 12, 1 spaced the same
Equal spaces must stand for equal amounts. Include 34 so each space is 14.
Missing a data point
Wrong:7 lengths but only 6 Xs
Cross off each value as you plot it, then count: the number of Xs should match the number of data values.
Helpful Math Tip
Cross off each data value as you plot it. When you finish, count the Xs to make sure none were missed.
Independent Educational Platform. FastChomp is published by Tropical Learning LLC and is not affiliated with, sponsored by, or endorsed by the Florida Department of Education. FAST and Star assessment names are referenced for informational purposes only. FastChomp practice questions are original educational materials, not official Florida FAST assessment questions.